

October 23, 2020
By Benson Toti
VeChain is ready to explode above a key resistance level
VeChain (VET) could see a massive breakout if bulls keep prices above a key level in the next few sessions. The bullish outlook for the token is taking shape after its value plummeted over 60% since surging to new 2020 highs in August.
But the token is making higher highs on the day and lower time frames, strengthening the weekly outlook.
The VET/USD pair is gunning higher on the back of broader gains across the altcoin market. Ethereum and ChainLink are among big movers today too, with alts taking a cue from Bitcoin’s jump to highs above $13,200.
VET/USD bullish outlook
VeChain experienced a major pullback after hitting highs of $0.023, with increased downward pressure taking its value to lows of $0.010.
Any attempt by bulls to take prices higher met with several hurdles. The price has remained capped below $0.013 for over a month now. However, the technical picture for the token over the past weeks has included a series of Doji candlesticks.
The pattern is also accompanied by a buy signal that has appeared via the TD sequential index. As seen on the chart below, the TD Sequential index already shows a red 8 candlestick and the formation of a red 9 would strengthen the buy signal for VET/USD.
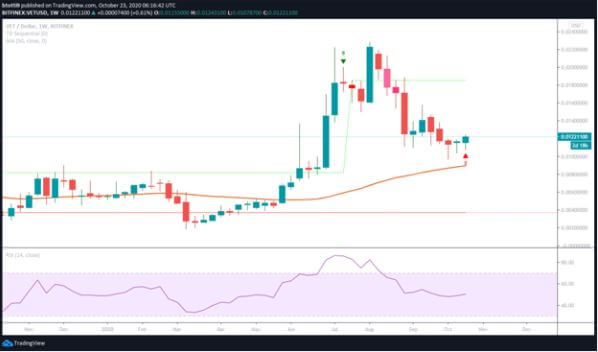
The suggestion is that bulls have increasingly taken control and that the tenacity shown by the bears is waning.
Moving onto the daily chart, VeChain is showing upward strength as indicated by the MACD and RSI.
The MACD suggests a bullish divergence as the 12 EMA curve has cut above the 26 EMA. But while VET/USD looks strong on the higher time frame, bulls have to break and sustain pressure above the 50 – day moving average.
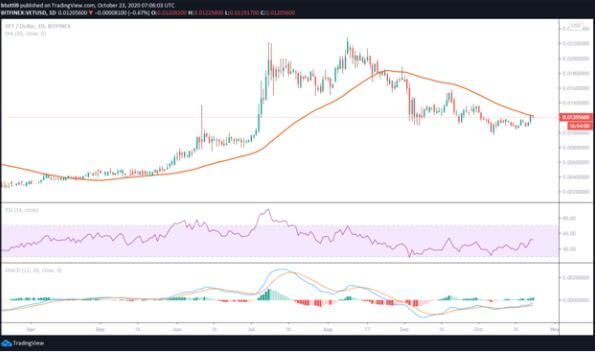
Above $0.012, the 100-SMA provides another hurdle near the September highs of $0.015. If bulls breach this wall, the next target will be the August 9 highs around $0.023 and beyond it a run to a new all – time high.
On the downside though, bulls must keep the price above 200 – SMA at $0.0112 on the daily chart. Failure to do so may result in a decline below $0.010 and would bring into play further rot to lows of $0.009.
At the time of writing, VET/USD is trading around $0.0120 and is changing hands 6% higher on the day.
https://coinjournal.net/news/vechain-candlestick-pattern-suggests-vet-ready-to-explode-above-0-015/

