

Litecoin breaks below $58 after testing a critical resistance line while ADA drops below $0.100
While Bitcoin (BTC) has traded higher over the past two days, several large – cap altcoins have struggled to piece together a similar trend. Ethereum broke above $400 but is back below the level, as is XRP that traded at highs above $0.25. Analysts say that the altcoin market will likely follow BTC if the king of crypto rallies to a new all – time high above $20,000.
Litecoin and Cardano are also struggling at the time of writing but could rally higher if bulls hold gains at key levels.
Litecoin price
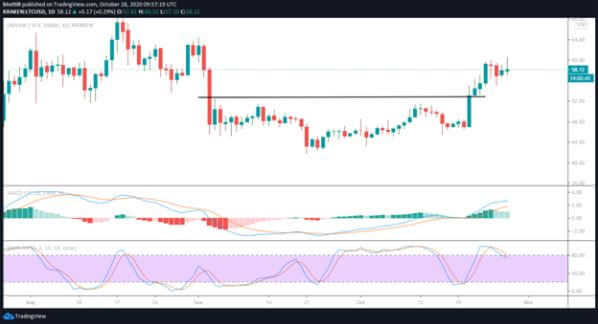
LTC/USD recently broke above a horizontal resistance line and touched highs of $61. The cryptocurrency is, however, suffering selling pressure as liquidity rotates to Bitcoin.
At the moment, LTC is trading just beneath a critical resistance area near the $60 area. If bulls push from current levels and break above the hurdle, a rally to highs near September 1 levels will confirm a potential bull run to highs of $84.
But the short term picture points to a decline before another leg up.
The price is above an inverse head – and – shoulders (H&S) pattern, but the daily MACD and Stochastic Oscillator suggest a bearish divergence. If bears take control, bulls will likely rely on the H&S neckline at $51 for refuge.
At the time of writing, LTC/USD is trading at $58, but despite a drawdown from highs of $61, bulls are likely to remain in control if they hold the level.
Cardano price
The price of ADA token has dropped by more than 5% in the past 24 hours to see it trade at lows of $0.099.
Although bulls have hit highs of $0.103 on the day, the increased sell – off pressure means that ADA/USD still faces a major resistance line that is preventing a retest of $0.11.
The ADA/USD pair is capped at the 50 – SMA on the 4 – hour chart, and if the downward flip continues, a dip to lows of $0.098 and $0.095 will be more than likely.
The technical picture also suggests bears are fancying a retest of the 200 – SMA line at $0.0926 on the daily timeframe. If this happens, bulls will have their work cut out if they have to break higher.
The daily chart also features a bearishly inclined MACD and RSI to suggest that the downtrend is likely to persist.
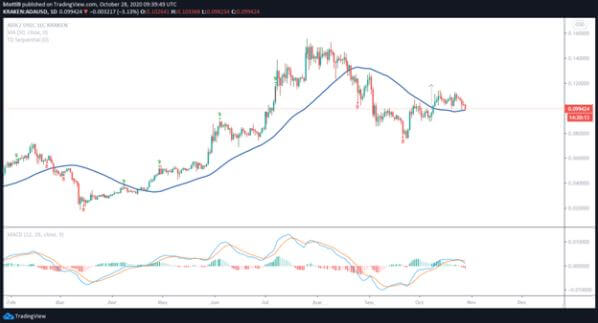
However, bulls can retake control if a key candlestick pattern forms in the next few sessions on the daily chart. The TD sequential has printed a red eight and the flip will be confirmed if a red nine appears.
https://coinjournal.net/news/price-update-litecoin-ltc-and-cardano-ada/

