If Litecoin (LTC) charts a price trajectory similar to Ethereum’s, it could climb to $250 within days
Litecoin’s crash from highs of $186 to lows of $111 in 48 hours (10—11 January) looked to have dashed bulls’ hopes of a dash towards the $200 level. It also meant LTC lagged as major assets hit new all-time highs. While the coin remains some distance from the all-time peak set in 2017, it’s likely the latest uptrend could see an LTC/USD target of $250.
Increased buy pressure around altcoins seen to hold value could be the catalyst for Litecoin as Ethereum leads the way with an impressive performance.
According to the on-chain analytics platform Santiment, LTC is back within the buy zone as suggested by the market value to realised value (MVRV) metric. The indicator looks at the coin’s profit or loss status with regard to when it last moved on-chain.
Litecoin’s 30-day moving average MVRV value is just picking up, to suggest current prices offer a buying opportunity.
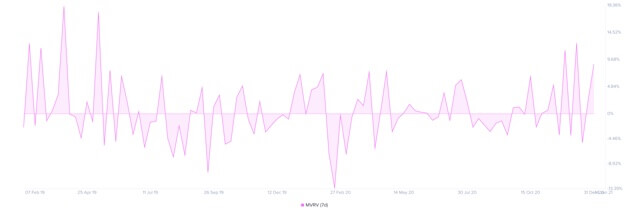
Litecoin’s 7-day MVRV chart. Source: Santiment
Litecoin price analysis
Litecoin price is looking to consolidate above a downtrend line that has so far capped its upside action.
A higher move above $155 will bring into focus the $160 resistance level and further invalidate the perspective of a downturn suggested by a bearish head and shoulders (H&S) pattern recently formed on the daily chart.
Thus, keeping prices above the neckline of the H&S pattern and the 20-day and 50-day exponential moving averages suggests bulls can successfully target higher levels.
The view will strengthen if buyers break above $160 and retake control above the supply wall near $165.
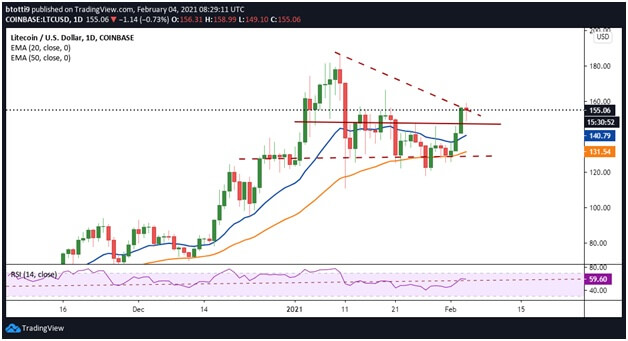
LTC/USD daily chart. Source: TradingView
The daily RSI is positive above 50 to suggest the LTC/USD pair has room to move higher if the resistance at $165 breaks. This move would likely call for more buy orders around $180—$200, with an uptrend likely to hold if these levels are reached in the short term.
On the 4-hour chart, Litecoin price has established a robust support zone around $120—$130 levels. Bulls have also managed to keep prices above the 50-EMA ($139) and 20-EMA ($145) since breaking above $130 on 01 February 2021.
Crucially, LTC/USD is holding above a horizontal support line that initially acted as strong resistance. If buyers break above a downtrend line formed on 10 January on the 4-hour chart, the main target would be the earlier mentioned $180—$200 region.
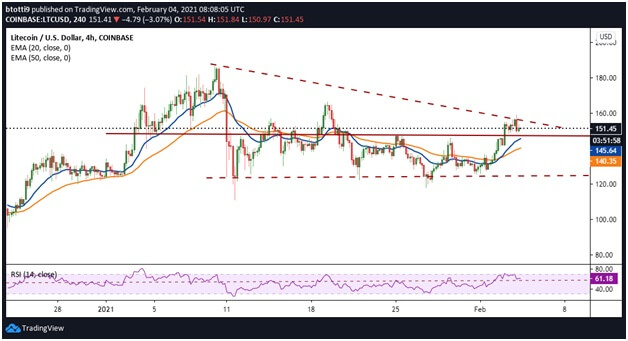
LTC/USD 4-hour price chart. Source: TradingView
Invalidation of the above scenarios will take effect if LTC/USD price breaks below $140 on the higher timeframes. The highlighted bullish view could turn negative and flip bearish if Litecoin continues lower and breaks major support at $120 on the daily and weekly logs.
As seen on the above chart, the ultimate prize for the bears would be a run to the 20-EMA ($107) and 50-EMA ($81).
https://coinjournal.net/news/litecoin-price-poised-for-a-breakout-to-250-amid-increased-buying/