If Ripple’s price slips below $0.50, losses could extend to $0.34
XRP price continues to hold within the $0.50—$0.65 range, a positive of sorts for Ripple bulls as most other assets have posted huge sell-offs over the past 24 hours.
Bitcoin (BTC) corrected 17% to dip below $50k and reached lows of $47,000 yesterday. Ethereum‘s price also retreated heavily to retest $1,650, dampening the bullish sentiment surrounding its breakout to $2,036. Most other altcoins saw double-digit losses, including Binance Coin, Polkadot and Litecoin.
While the XRP/USD pair could still bounce off $0.50, a lack of upside momentum during the early trading session is putting pressure on bulls. Here’s what the technical picture for XRP/USD looks like.
Ripple price daily chart
After breaking lower from highs of $0.57, XRP bulls have failed to establish control above $0.5250. The area is proving stubborn to navigate, with sellers forcing prices back to the $0.50 support multiple times already this morning.
If fresh buying momentum takes XRP past resistance levels at $0.57 and $0.65, the next target lies around the $0.78 level.
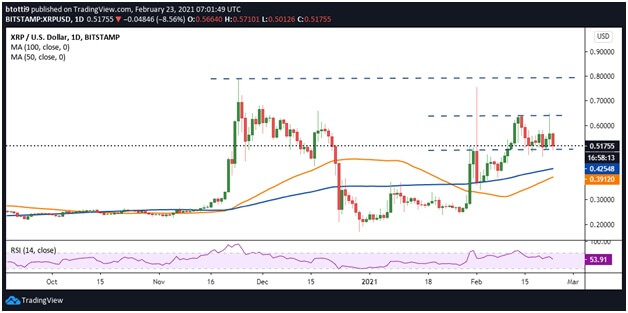
Although the XRP/USD pair remains within the $0.50—$0.65 range, bulls have to keep the support level intact if they are to avoid handing control to the sellers. In case the prices dip below $0.50, XRP could plunge to lows of $0.34.
This might be the case given the daily RSI is looking to dip below 50. If bears seize control on increased selling pressure, a further correction could force bulls to defend gains around the 100-SMA ($0.4254) and the 50-SMA ($0.3912) support zones.
Ripple price 4-hour chart

On the 4-hour chart, XRP price has broken below the 50-SMA ($0.5427) and 100-SMA ($0.5309). Bears are also looking to extend the losses beneath a crucial support trend line of an old ascending triangle pattern.
If bulls recover and push higher, flipping the 50 and 100 simple moving averages back into support could help propel prices to $0.60 and the resistance line of the ascending triangle at $0.65.
On the other hand, if XRP/USD dips below $0.50, immediate losses could extend to the 200-SMA at $0.4353 and then XRP’s monthly low of $0.34.
At the time of writing, bulls are trying to hold off sellers just above $0.50, adding to the downside risk.
https://coinjournal.net/news/ripple-price-analysis-failure-to-bounce-off-0-50-risks-sending-xrp-to-0-34/