
BTC/USD has failed to clear resistance near $55,800, a level bulls need to breach to target $60k
Bitcoin continues to struggle for an upside following its recent downward correction. The cryptocurrency’s price against the US dollar remains largely unchanged over the past 24 hours as bears try to restrict action below the $55k level.
Buyers will need to regain the upper hand to prevent another dip. The technical outlook on the 4-hour chart certainly suggests BTC/USD is delicately poised, but the advantage is with the bulls.
Bitcoin price outlook
While the price might correct lower, some analysts are predicting fresh gains for Bitcoin in the short term.
According to Raoul Pal, the founder and CEO of Global Macro Investor, Bitcoin is “oversold” and the weekly RSI is printing levels last seen during the 2017 bull run. The analyst suggests that the corrections being witnessed helps to “refresh” the bull market.
The weekly RSI is close to the levels that we saw in corrections in the first part of the 2017 bull run, before bitcoin hit hyperspace. These are the pauses that refresh a bull market. pic.twitter.com/gWlivsebPv
— Raoul Pal (@RaoulGMI) April 25, 2021
Another analyst has pointed to the Stock to Flow (S2F) model, suggesting that Bitcoin is yet to top out. According to Rekt Capital, Bitcoin has previously peaked whenever the price moved above the S2F line. He predicts a new uptrend for BTC/USD once the benchmark cryptocurrency bottoms.
BTC Bull Market tops occur when #BTC‘s price deviates beyond the Stock to Flow line
S2F line will begin to flatten out in early May
So once #Bitcoin bottoms on this correction…
The next uptrend will likely be the one to perform that upside deviationhttps://t.co/mRRRDml9z8 pic.twitter.com/BU4RDhWEbz
— Rekt Capital (@rektcapital) April 27, 2021
Bulls have managed to hold BTC’s price above the major descending trend line and the 0.618 Fib level. The MACD remains above the signal line, although it is weakening, and the RSI is above 50 to give buyers the upper hand.
Two main resistance levels likely to thwart bulls are at $55,971 and $58,078. If the price clears these barriers, it could accelerate beyond $60,000.
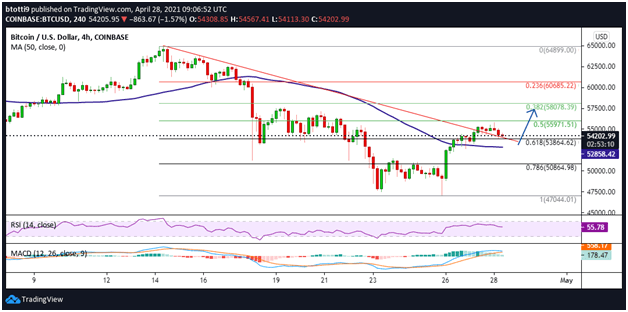
BTC/USD 4-hour chart. Source: TradingView
On the downside, another dip would see prices break towards the 50 SMA ($52,861). The main support zone is at the 0.786 Fib level ($50,864), but Bitcoin could trade as low as $47,000 if the correction extends beyond the $50k level.
https://coinjournal.net/news/bitcoin-price-analysis-heres-why-btc-might-refresh-towards-60k/