

November 11, 2020
By Benson Toti
OMG/USD price is above $3.40 but could drop to lows of $3.00 as suggested by the TD sequential indicator.
OmiseGO (OMG) is up 7.7% in the past 24 hours and the bulls look to strengthen above a crucial resistance level. However, the technical picture suggests that the price of OMG Network’s token could slip to lows of $2.60 if the bears strengthen their case as seen on the hourly chart.
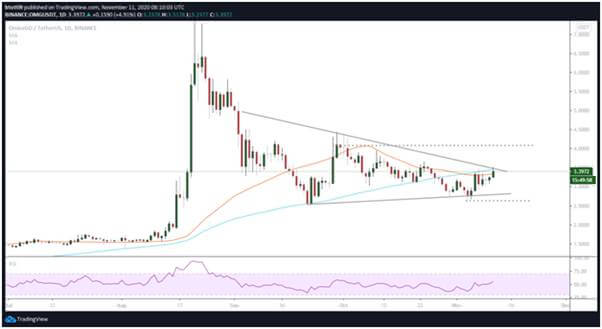
OmiseGO price hourly chart
OMG price on the hourly chart shows a sell signal has formed in the last few hours, with the value of the token against the US dollar trading down from highs of $3.51 to lows of $3.31.
On the 4th of November, OMG/USD traded at a low of $2.62, with downward pressure contributing to the decrease in price. An influx of buyers, however, pushed the token upward. A decent rebound in the sessions that followed then took it to highs of $3.45. But bears refused to cede further ground and the price plummeted again to $2.96 after a sell signal flashed on the hourly chart.
Another bounce established support levels above $3.00, but the existence of a stubborn resistance line above these zones suggests that OMG/USD remains vulnerable to another downside. To support the outlook is the TD sequential indicator that is suggesting a bearish flip as can be seen in the chart below.
The TD sequential indicator on the hourly chart for OmiseGO has formed a green nine candlestick. The indicator suggests bears could push prices as low as 100-hourly simple moving average at $3.20. Beyond this level, further damage could see the bulls rely on the massive support wall provided by the 200-SMA near $3.06.
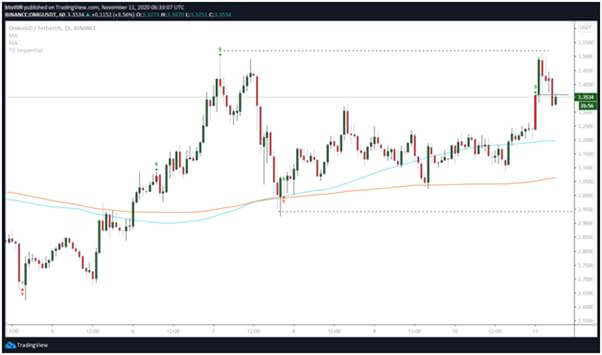
OMG daily chart
The daily chart suggests the bearish flip on the lower time frame might be short-lived as bulls are looking strong. However, they will need to close above $3.50 to retain the upper hand. The RSI indicator shows buyers are beginning to take control, although that could fail to hold if prices fall back below the 50-SMA line at $3.33. The area has acted as a stubborn resistance line since the 25th of 0ctober.
If they break seller resistance at the 50-SMA, buyers can aim at the 100-SMA near $3.46 and open up a path to the next target at $4.00.
Conversely, a breakdown will spell short term trouble for buyers. As of now, the area near $3.06 is the only major support zone, which had also helped absorb the downward pressure on the 7th of November.
If increased downward pressure materialises, the prices could drop to $2.62 and then to the 21st of September lows of $2.44.
https://coinjournal.net/news/omg-network-flashes-sell-signal-as-bears-look-to-take-charge/

