Ethereum traded at a new all-time high of $1,918, registering a new milestone of its own as Bitcoin created history by rallying to $52.6k
Ethereum (ETH) jumped to a new all-time high above $1,900, reaching the milestone after a few days of sideways trading having previously peaked at $1,874.
But after Bitcoin broke the $50k resistance line and then added two more milestones at $51k and $52.6k, Ethereum bulls took the cue and pushed higher.
The upward pressure saw ETH price break short-term resistance near $1,855 before cooling off at $1,918.
Ethereum price spiked amid whale accumulation
According to on-chain data analytics platform Santiment, Ethereum’s move above $1.9k followed an increase in the number of whales with 10k+ ETH holdings.
“Ethereum answered #Bitcoin’s #AllTimeHigh today with one of its own, crossing $1,900 for the first time in its ~6 year history. The number of whale addresses (holding 10k+ $ETH) ballooned to 1,287 on #ValentinesDay, foreshadowing this achievement.”
At the same time, Grayscale Investments has bought 20,000 ETH for its investors, highlighting the interest in Ethereum among institutional investors.
Although prices have retreated below the $1,900 mark, a look at technical indicators suggests buyers could be on the verge of a bullish breakout to $2,000.
Ethereum price analysis
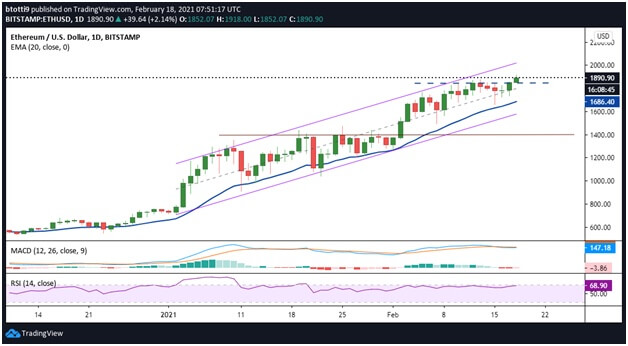
Looking at technical indicators on the daily chart, we see momentum remains with the bulls despite the price drop to lows of $1,880. The MACD is looking to turn the momentum in bulls’ favour as it prints a hidden bullish divergence, while the daily RSI is just rising into the overbought territory.
ETH has also maintained an old ascending parallel channel, with price above the 20-day EMA and yet to flip bearish since the breakout from the horizontal resistance line at $1,400. If buying pressure pushes ETH/USD to the upper boundary of the channel, it would put it around $2,011. From here bulls could target the zone around $2,200.
The 4-hour chart shows Ethereum rallying higher after a breakout above a descending resistance line. The upside above the hurdle saw the ETH/USD pair establish support at $1,852 and $1,874 (previous ATH). An inverse head and shoulders pattern suggests the potential for more gains above the neckline.
Notably, the breakout to its peak coincided with a strengthening of the MACD and the 4-hour RSI. As the chart shows, Ethereum’s price is likely to surge further on the strength of these indicators.
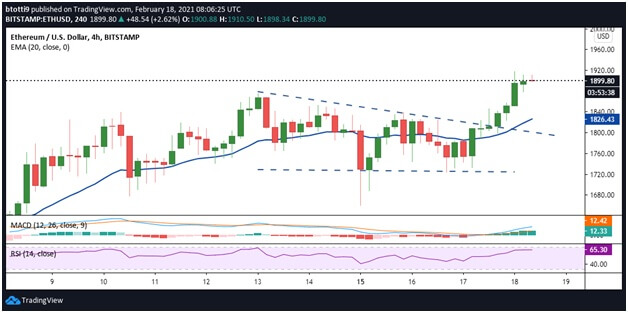
The contrary perspective would have ETH price dipping below $1,850 and the 20-day EMA ($1,826). If bears increase their effort below this support zone and manage to retest the old descending trend line, the next support could be at $1,760 and $1,720. The breakout point marked by the $1,400 resistance line offers a robust anchor.
https://coinjournal.net/news/ethereum-price-eth-primed-for-2000-as-btc-looks-to-settle-above-52k/