

DOT rallied above the $20.00 resistance level to reach a new all-time high of $21.56
Polkadot (DOT) has traded at a high of $21.56, a new record for the cryptocurrency that traded as low as $2.60 on 20 August 2020. The upside above $20.00 means DOT price is now over 644% up over the past five months.
And with sentiment across the crypto market trending north, Polkadot could yet surge higher. For DOT/USD, another fundamental driver of an upside could be the launch of a DOT-based ETP scheduled for 4 February 2021.
According to the ETP provider 21 Shares, the exchange-traded fund will be listed on the Swiss SIX Exchange, allowing even more institutional involvement in the asset. The product will be 100% collateralised against the DOT price, with 21 Shares providing a guarantee to on-exchange liquidity.
A positive outlook from this event is likely to improve the technical picture and see DOT bulls target the $24-$30 range.
At the time of writing, DOT/USD is trading at $20.40, with intraday price change at 18.5%. Trading volume has spiked 120% to over $6 billion, with market capitalisation rising to $18 billion.
DOT/USD price outlook
Polkadot price has hit resistance after reaching the intraday high that also marks its ATH. Bulls have faced increased sell pressure near $21.00, with bears’ interest likely pegged on retracing to the 20-day EMA ($16.54). The moving average provided the rebound platform that saw buyers push to $21.56 during the Asian trading session.
Keeping prices above the 20-EMA on the daily chart is thus critical to bulls’ plans to retest the intraday peak. If the DOT/USD pair stays above $20.00, the chances of another leg up in the next few sessions increase.
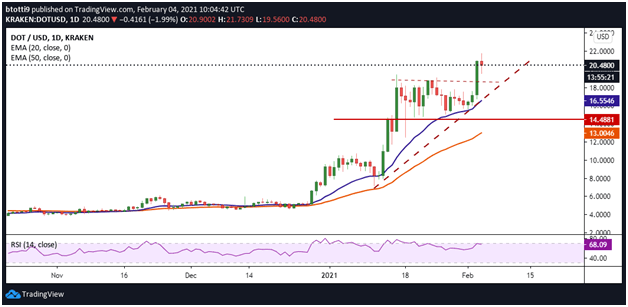
DOT/USD daily chart. Source: TradingView
A breakout above $21.00 could see the DOT/USD pair target $24.00, with $30.00 coming into focus if buying pressure sustains.
The RSI is just below the overbought zone to suggest bulls hold the advantage. The exponential moving averages also support an uptrend as can be deduced from the rising curves.
The above perspective could invalidate if prices break lower. A reversal to the previous resistance line at $18.64 could aid sellers and see DOT/USD begin a downtrend.
While the 20-day EMA ($16.55) offers strong support, failure to consolidate near this level could see prices drop to the horizontal support line at $14.48. If bears sink DOT/USD below this anchor, the next stop could be the 50-day EMA ($13.00).
https://coinjournal.net/news/polkadot-dot-hits-ath-at-21-56-following-its-etp-launch/

